My personal projects
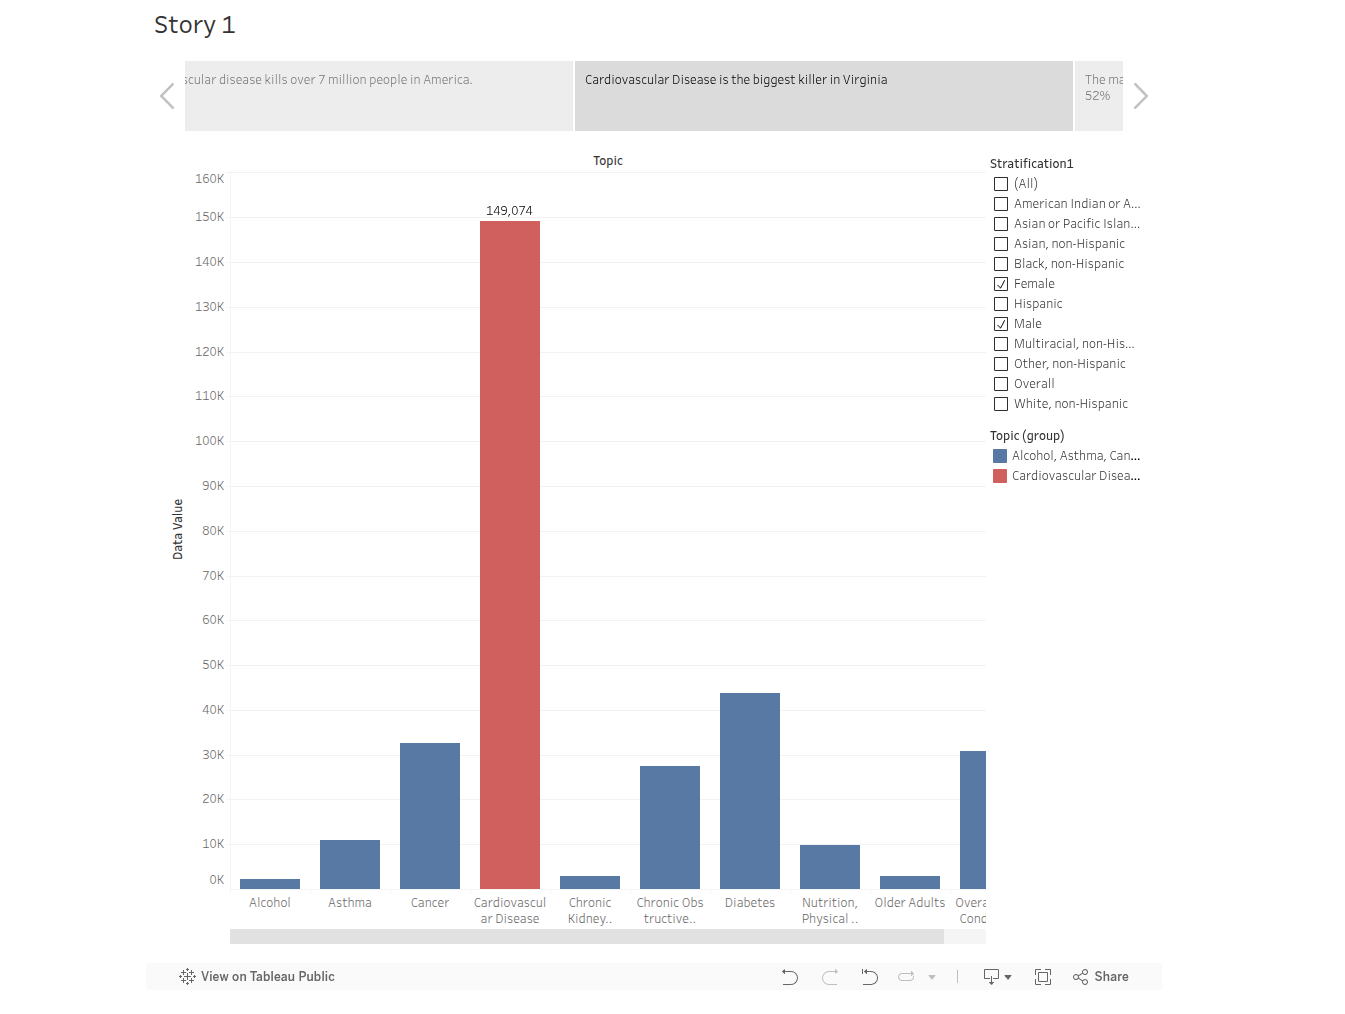
- Data Visualizations from CDC dataset
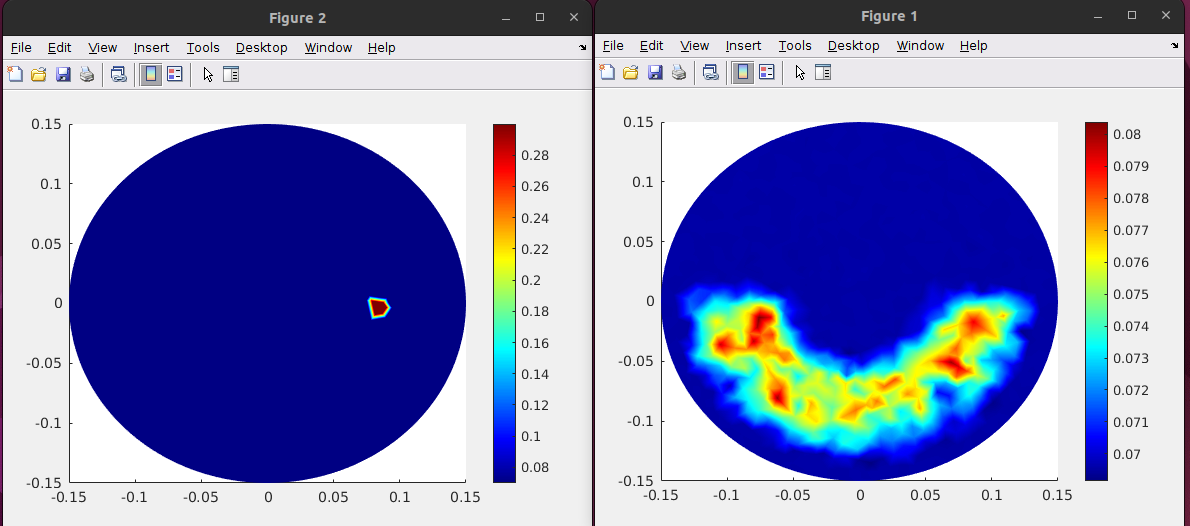
- Inverse Problem Modeling and ML
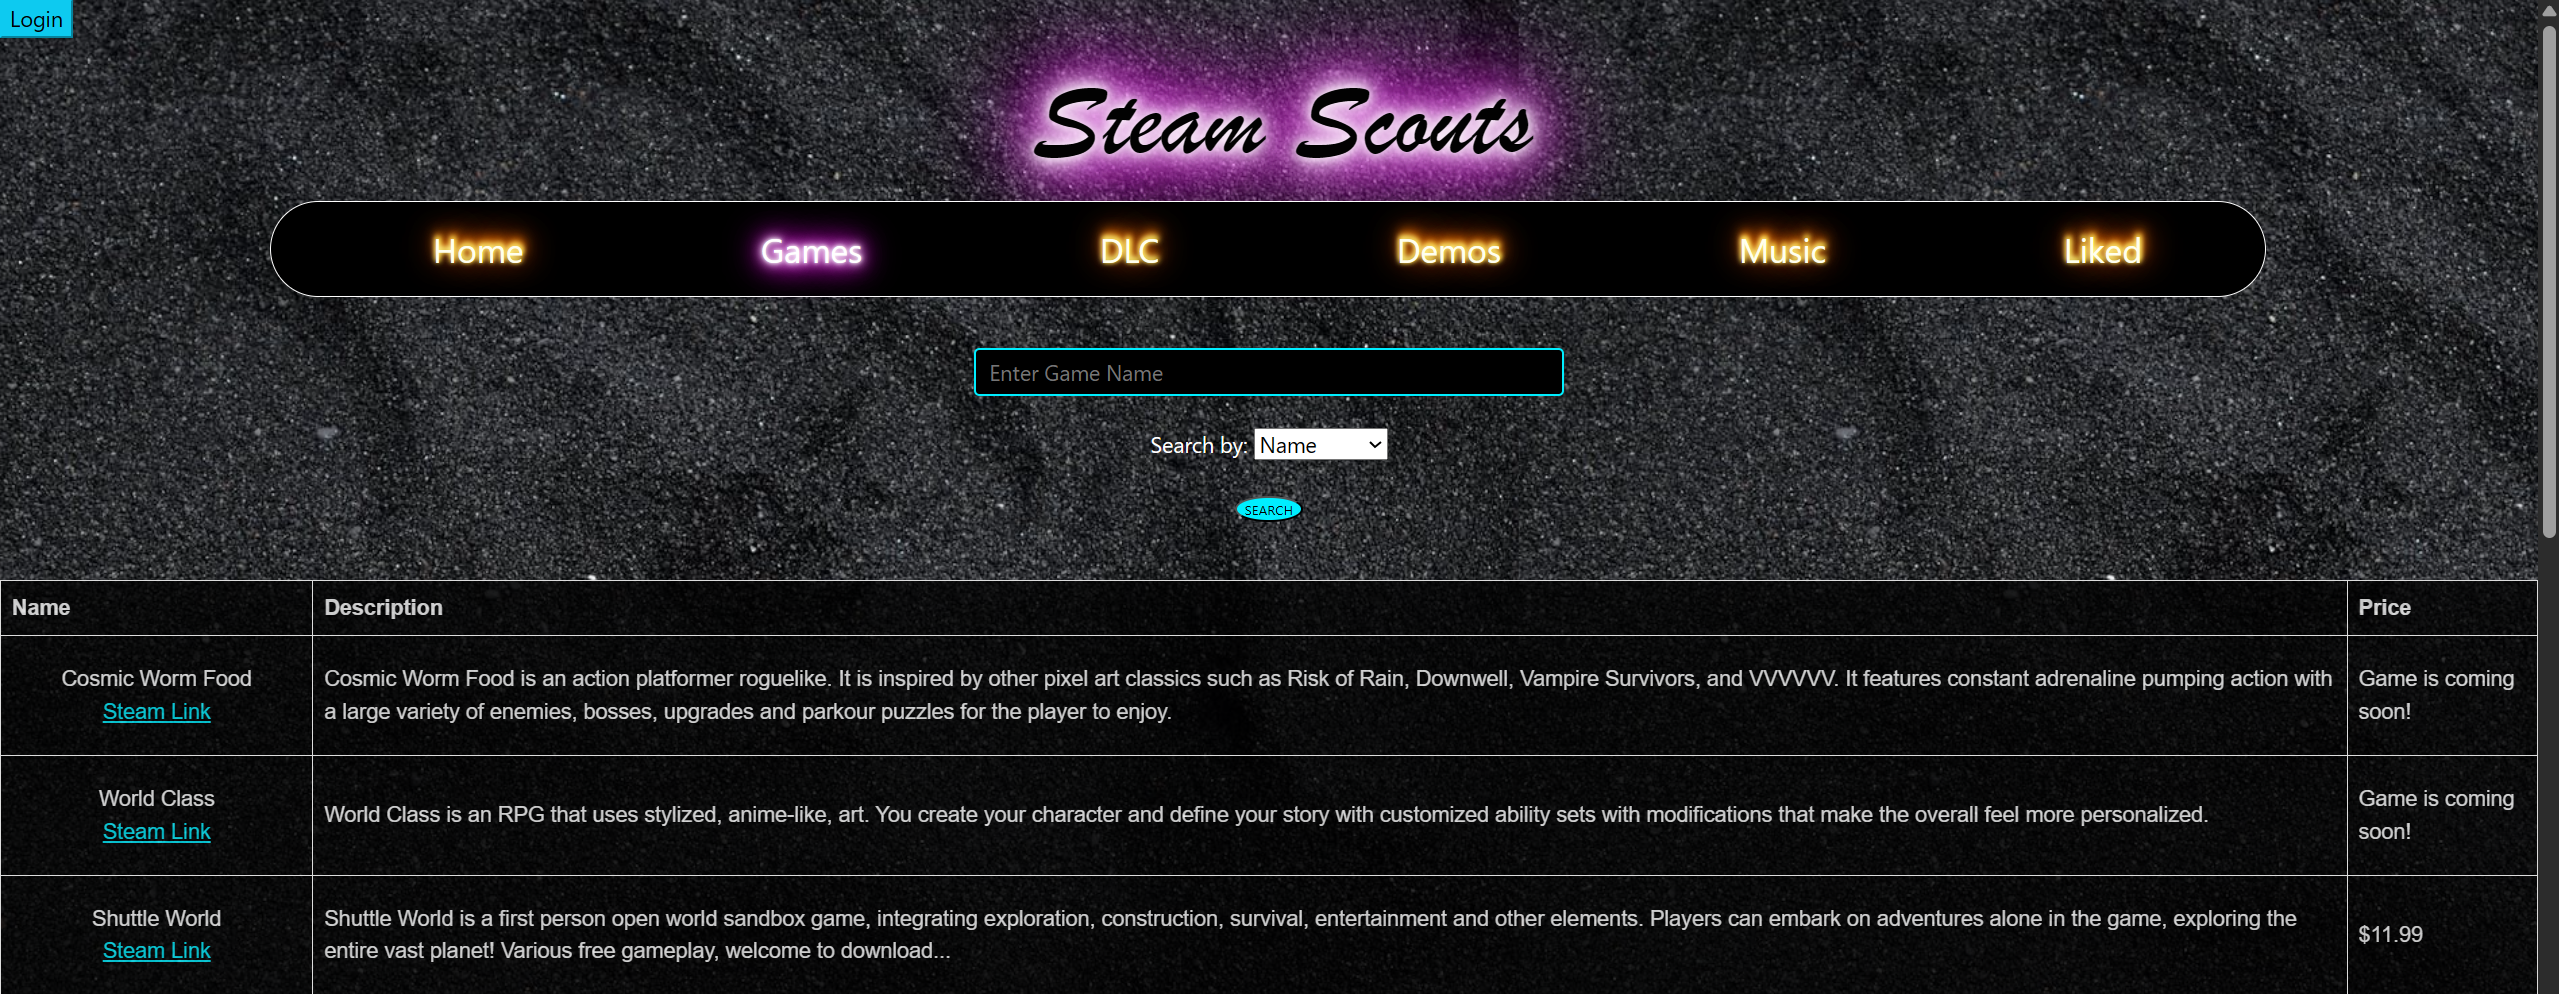
- Steam Scouts
Tableau Visualization can be found here ↓
https://public.tableau.com/app/profile/isaac.watts/viz/Disease_indicators_and_insights_IW/Story1 - Cleaned data and filtered out null values directly within Tableau to ensure accurate
visualization.
- Built a multi-page dashboard exploring trends in chronic diseases by state (mainly Virginia),
gender, and
demographics.
- Leveraged Tableau's storytelling tools to highlight key insights on health disparities and risk
factors.
- Designed interactive elements (filters, highlighters, parameter controls) for user-driven
exploration.
- Simulated voltage readings from a circular mesh with an embedded inclusion using MATLAB.
- Trained a neural network to localize the inclusion based on voltage patterns using Python (ELU +
MSE
loss + Adam optimizer).
- Reconstructed 2D images of the mesh to visualize inclusion location from the neural net’s
predictions.
- Combined physical modeling and machine learning to solve an inverse imaging problem.
- Created a MySQL-backed Django web app to collect and explore Steam game metadata from Steam’s web
API.
- Parsed and stored structured data (e.g., game type, price, DLC) using Python and SQL connector.
- Enabled filtering and querying by game type, release date, and content type.